

Findings from the Powering Australia and Cyan Ventures analysis of the clean tech manufacturing opportunity
Clean tech manufacturing has grown into a A$2 trillion global industry, and Australia supplies many of the raw materials that feed it. Yet we capture only around 1.5% of the value, and our manufacturing sector has shrunk to just 1% of GDP. We dig up the lithium, ship it offshore, and then buy it back inside someone else’s battery.
It does not have to stay that way. Powering Australia partnered with Cyan Ventures to examine more than 40 clean technologies across four sectors of the economy (generation, networks, industrial decarbonisation and transport) and answer two questions: where can Australia genuinely win in clean tech manufacturing, and how?
A trillion-dollar industry, and we’re standing at both ends of it
The energy transition is being driven by cost, sustainability and national security at the same time, and it has already produced exponential growth in renewables, storage, transmission and electric vehicles. Green industrial commodities and carbon capture are expected to follow. This is not a market Australia needs to create; it already exists, and it is still growing.
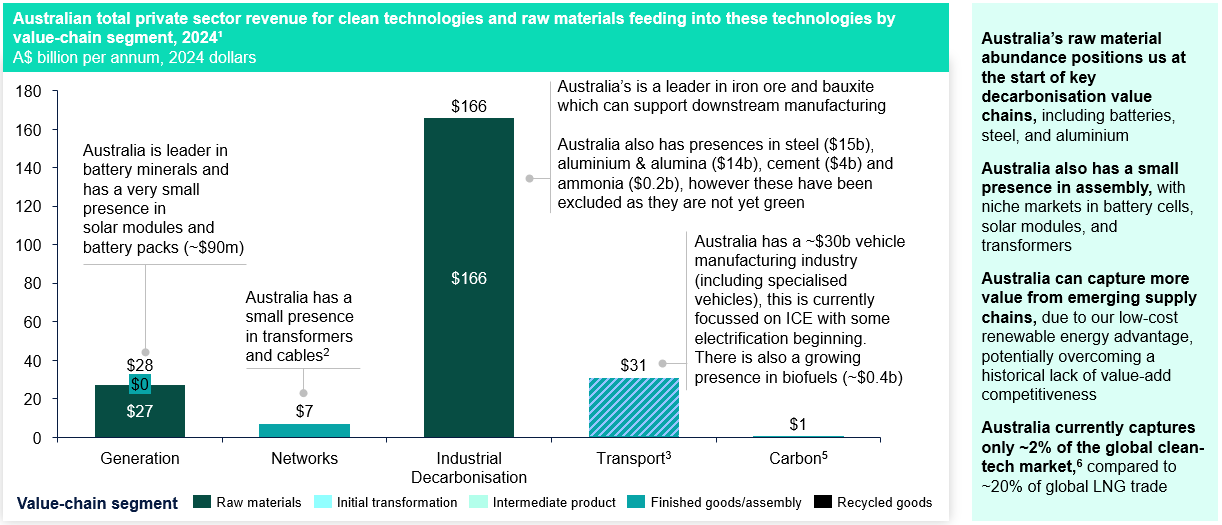
Australia has the ingredients to compete, including world-class renewable resources, abundant land, deep critical mineral endowments and a skilled workforce. Yet our participation is concentrated at the two ends of the value chain: extracting raw materials at the start, and installing finished imports at the end. The value-adding middle, where most of the A$2 trillion sits, is where we are largely absent.
Exhibit 1: Australia’s presence is limited to the start and end of value chains, with little activity in the value-adding middle (A$2024 billion).[a]
This is a vulnerability, not just a missed opportunity
Clean tech manufacturing is extraordinarily concentrated. China holds between 75% and 98% of the solar PV value chain and dominates most battery components, Japan controls around 58% of wind nacelle manufacturing, and China and South Korea lead in battery cathodes and cobalt refining.
That concentration cuts against Australia twice. As a buyer, we depend on a handful of foreign suppliers for the equipment our own energy transition runs on. As a seller, we ship raw materials into value chains over which we have no leverage. A single trade dispute or shipping disruption could stall the transition here, and we would have little say in the matter.
The answer is not to try to win at everything
Australia’s past attempts at industry policy have often failed for precisely that reason: spreading effort and subsidy across everything rather than concentrating on the areas where we can genuinely compete. So we applied three tests to every opportunity:
- Can Australia compete on cost, by leveraging natural resources, land, an existing skill base or low-cost renewables?
- Can it differentiate, through Australian innovation that outperforms globally or solves a uniquely local challenge?
- Or does building the capability at home create resilience in a critical supply chain exposed to shocks and bottlenecks?
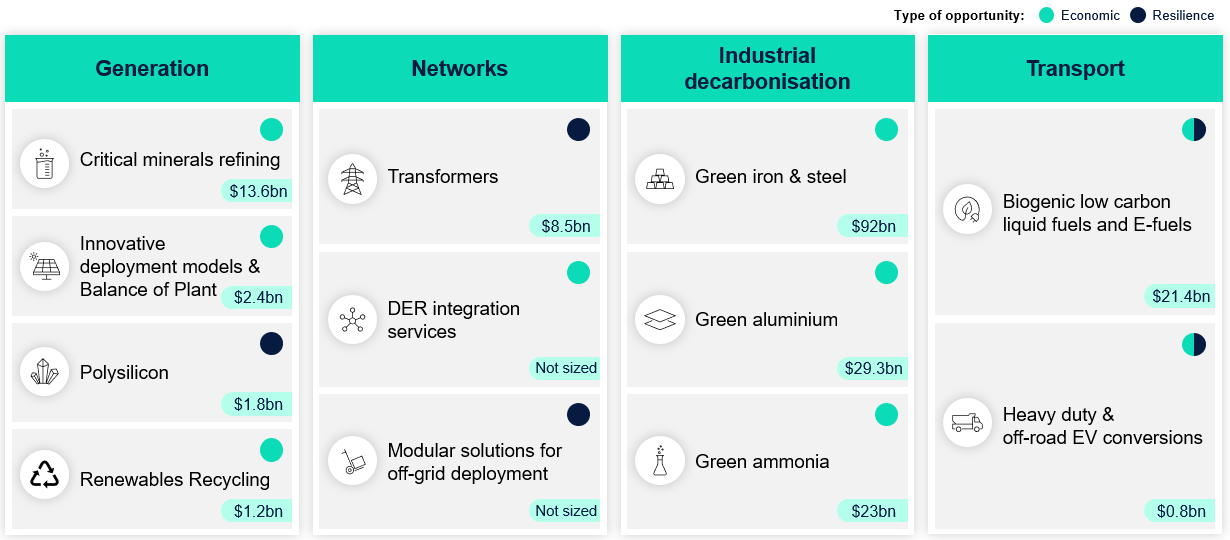
Most of the 40-plus opportunities did not pass. Twelve did, spread across the four sectors: from critical minerals refining, polysilicon and renewables recycling in generation, to transformers in networks, green iron and steel, green aluminium and green ammonia in industrial decarbonisation, and low carbon liquid fuels and heavy vehicle electrification in transport.
Exhibit 2: Twelve opportunities across four sectors emerged as most competitive for Australia.[b]
How Australia wins
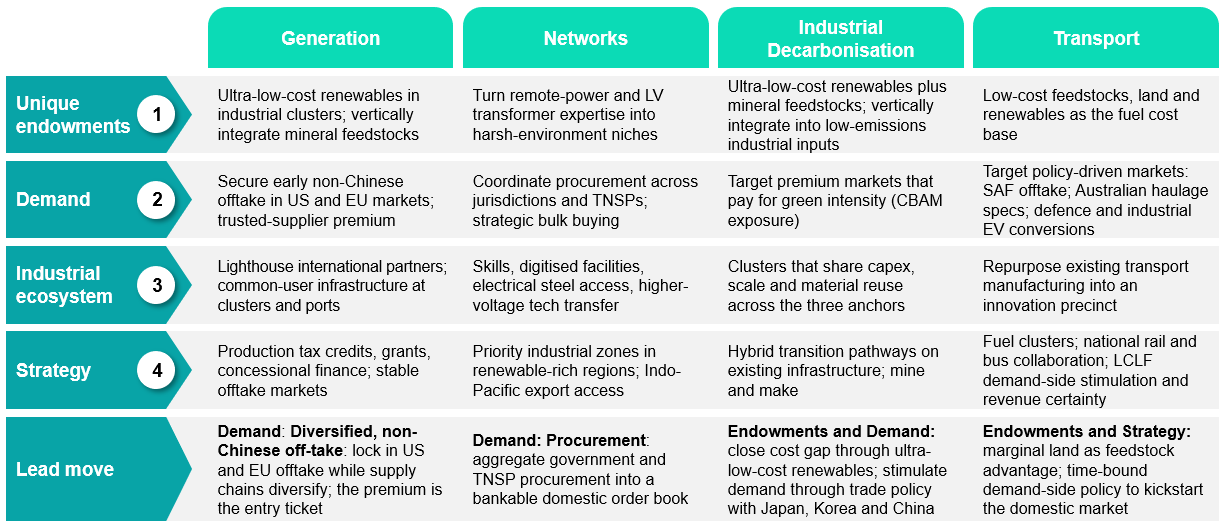
Across all twelve opportunities, the recipe for building a competitive industry rests on the same four foundations.
The first is to build from our unique endowments. Ultra-low-cost renewable energy, mineral feedstocks, abundant land and pockets of specialist expertise are the underlying advantages that can close the cost gap with established producers. In industrial decarbonisation, for example, cheap renewable energy located alongside mineral feedstocks is what makes Australian green iron and ammonia competitive against incumbent suppliers.
The second is to secure demand early, because new manufacturing industries fail without committed buyers. For solar and battery manufacturing in the generation sector, that means locking in offtake in the United States and Europe while those markets pay a premium for trusted suppliers outside China. For transformers, it means aggregating government and network procurement into a bankable domestic order book that justifies investment in local production. In industrial decarbonisation, it means targeting the premium markets that pay for green intensity, particularly customers exposed to carbon border adjustments.
The third is to build the industrial ecosystem around each opportunity: common-user infrastructure at ports and industrial clusters, partnerships with established international manufacturers, and the specialist workforce these industries will draw on.
The fourth is supportive strategy and policy, including production tax credits, concessional finance, priority industrial zones in renewable-rich regions, and stable demand-side settings such as low carbon fuel standards that give investors revenue certainty.
Every sector needs all four, but each starts from a different place. Generation leads with demand, because the premium paid for diversified supply is the entry ticket. Networks also leads with demand, through coordinated procurement. Industrial decarbonisation leads with endowments and demand together, using low-cost renewables to close the cost gap and trade relationships with Japan, Korea and China to open markets. Transport leads with endowments and policy, converting marginal agricultural land into a feedstock advantage for renewable fuels and using time-limited demand-side measures to establish the domestic market.
Exhibit 3: The same four foundations underpin every sector; what differs is the starting point
The prize: A$160 billion and 140,000 jobs
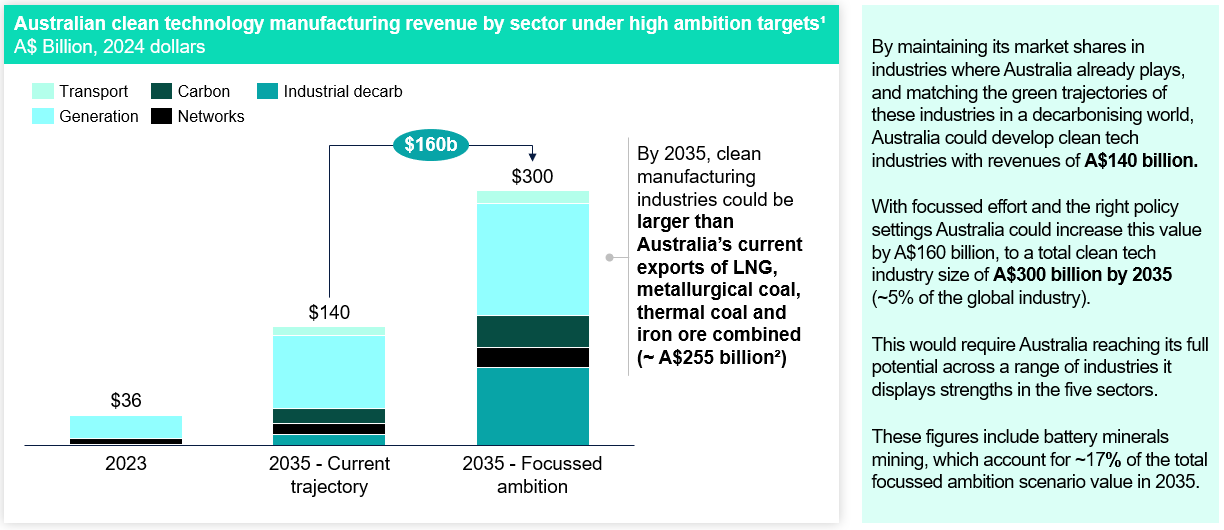
If Australia built capability in these twelve areas, it could add up to A$160 billion in annual revenue and 140,000 direct jobs by 2035, compared with our current trajectory. This reflects a modest share of a market that will keep growing regardless of what we do; the question is whether that growth happens with Australian industry in it.
Exhibit 4: With focussed ambition, Australia could add up to A$160 billion by 2035 compared with the current trajectory (A$2024 billion).[c]
None of this happens on its own
The market will not hand Australia a manufacturing base, and every country capturing this value today made deliberate choices to get there. For government, that means aligning Future Made in Australia investment behind the twelve priorities rather than spreading it thinly. For industry, it means investing further up the value chain in the areas where the economics now work. For investors, it means recognising that supply chain resilience has become a source of commercial value rather than a policy talking point.
Powering Australia’s role is to connect the miners, manufacturers, researchers, First Nations enterprises, investors and governments who can make these twelve opportunities real, and to help build the workforce they will need. Australia has spent a century proving it can dig things up. The next decade will determine whether we can also make the technologies the world is buying, and the analysis shows we can, provided we choose our ground and commit to it.
Explore the sector deep-dives:
Generation | Industrial Decarbonisation | Transport | Networks
Footnotes:
[a]. Various sources. 1. Cyan Ventures and Deloitte analysis. 2. Network-related minerals (e.g., copper cathodes) are processed offshore, complicating their attribution 3. Battery minerals are captured in generation. Figure includes ANZSIC class 23 Transport manufacturing value-added. Component manufacturing has been considered as an intermediate product. This figure also includes repair services for shipbuilding, aircraft and rail transport. ANZSIC class 2461 and 2462 have also been included as they include off-road mining and agricultural vehicle manufacture, however, this also includes non-transport figure and may slightly inflate the figure (max inflation would be $2b). See ABS (2025) 5. Carbon can be considered a raw material or finished good. Considered here as finished good. Assumes 2024 total ACCU issuance of 18mt at an average price of A$34, see CER (2024), 6. Excl. value from mining (e.g., iron ore, battery minerals) which is not considered in global market sizing for clean tech of A$2.1trillion and from vehicle manufacturing which is not yet fully green.
[b] Cyan Ventures analysis (2025). Estimate reflects gross value added under the Focussed Ambition scenario in 2050. GVA values are reported to one decimal place.
[c] Various sources: Detailed methodology and accompanying model available upon request. Mining excluded (i.e., iron ore, bauxite). There will likely be a transfer of some value from these industries to develop the downstream value-added industries. Note: numbers have been rounded.