

Three opportunities that could add over A$7 billion to the Australian economy by 2035
The generation supply-chain (solar, wind, batteries) is the largest single segment of the current global clean tech manufacturing market and the foundation on which most other clean tech depends. Global generation capacity rises around sevenfold by 2035 under net-zero pathways, attracting roughly US$800 billion in annual investment.
15 value-chain segments were assessed for Australia’s potential competitiveness and need for supply-chain resilience across the supply-chains for solar, batteries and wind. Australia’s strongest potential lies in three areas which could add over A$7 billion to Australia’s economy by 2035:
- Critical Mineral Refining: refined critical minerals that are mined for battery production in Australia.
- Polysilicon: polysilicon sold into a non-Chinese market produced in partnership with a foreign technology partner.
- Deployment/Balance of Plant (BoP): key pieces of equipment that help drive down the levelised cost of energy production in Australia.
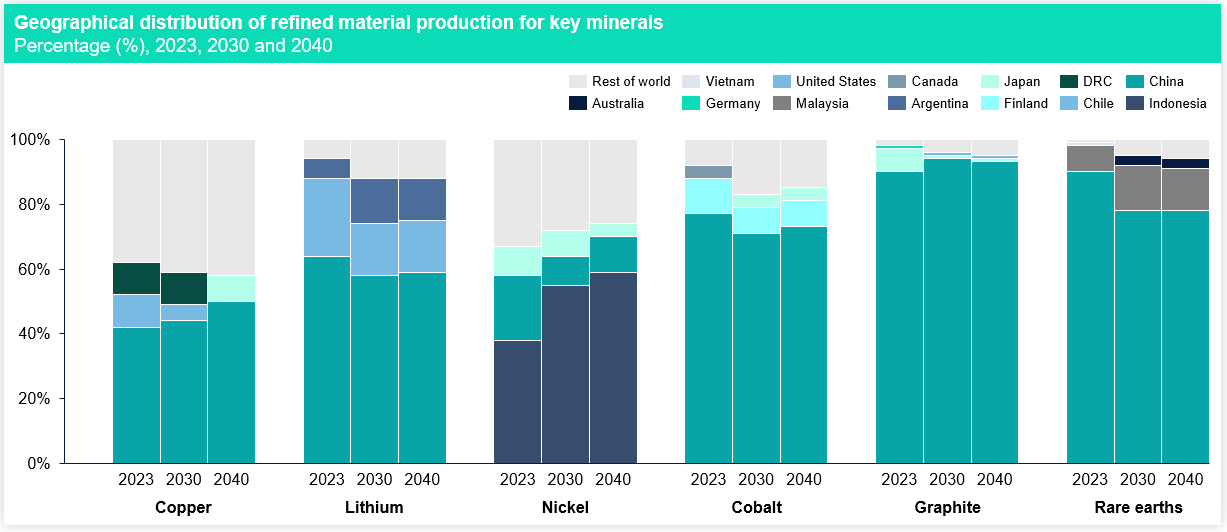
Regarding critical minerals refining, Australia has a strong competitive edge in refining battery inputs like lithium, nickel, cobalt, and rare earths due to its abundant reserves and potential for vertical integration. As the world’s largest lithium producer and a key player in nickel and cobalt, Australia can co-locate refining with mining operations to reduce transport, input, and permitting costs. This integration can deliver cost savings of up to 30% compared to standalone refineries, while also lowering waste management costs through shared residue infrastructure.[a] While labour and capital costs are higher than some global peers, targeted policy support, such as production tax credits, can help offset these pressures. Together, these factors create a credible path to globally competitive refining that captures more value onshore and also develops supply-chain resilience in a critical supply-chain which is currently dominated by China (rare earths, lithium, cobalt) and Indonesia (nickel).
Exhibit 1: Australia can drive costs down in lithium hydroxide and carbonate processing through vertical integration to meet market leading prices (US$2025 per kilogram).[b]
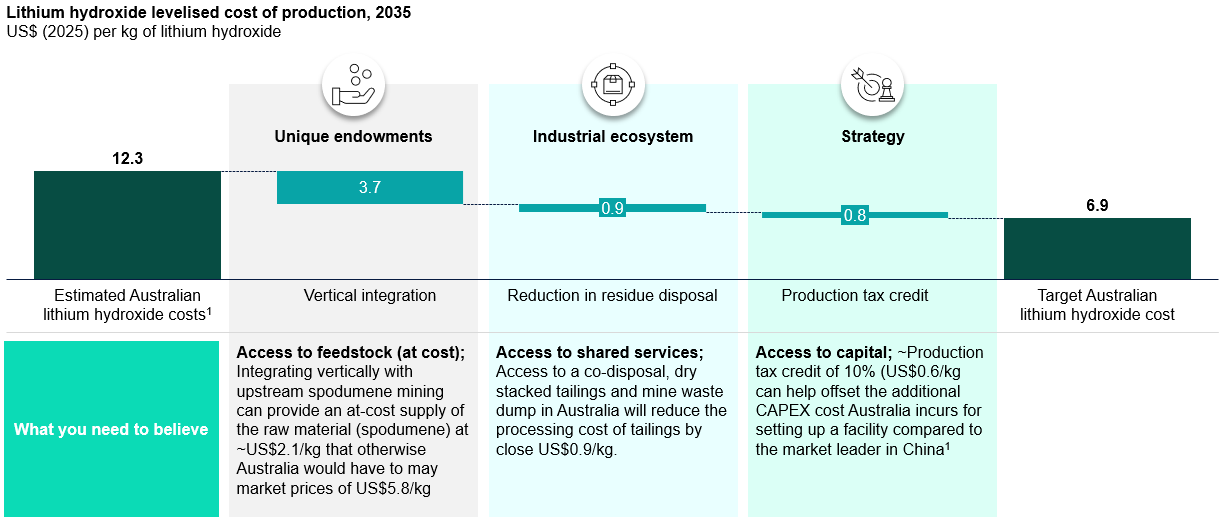
Exhibit 2: Developing Australia’s refining capability can guard against potential supply-chain bottlenecks.[c]
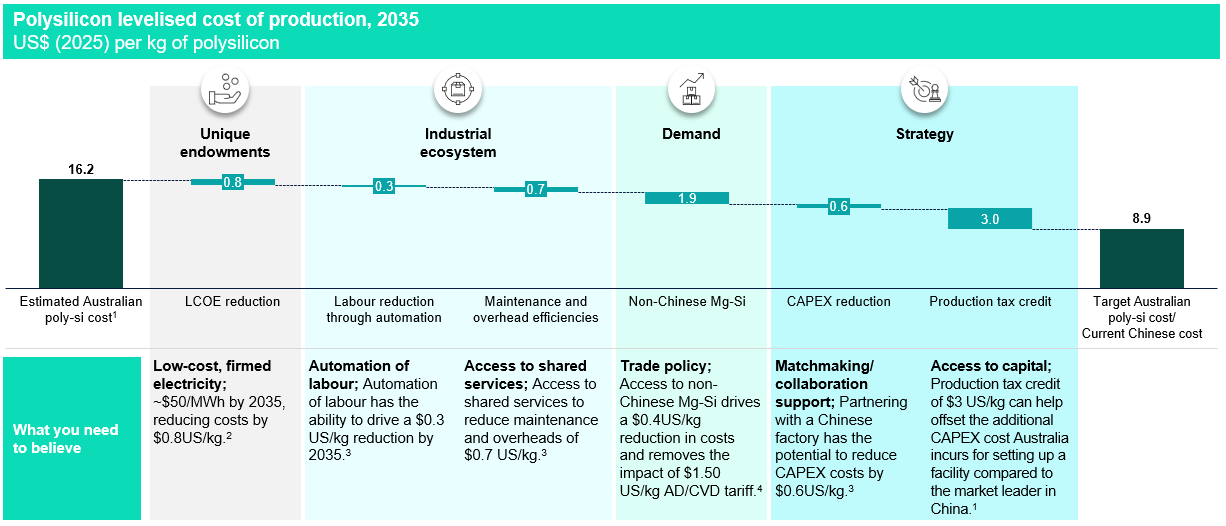
In terms of polysilicon, whilst Australia currently faces an 82% cost disadvantage relative to China (US$16.2/kg vs US$8.9/kg),[d] it has a credible pathway to reduce costs to ~US$12/kg by 2035, and as low as US$9/kg with targeted support. Key enablers include access to ultra low-cost renewable electricity, automation to offset labour costs, and vertical integration with non-Chinese feedstock to avoid tariffs. Although polysilicon accounts for just 12-15% of total module costs, non-Chinese material currently trades at up to 4x China prices in the U.S. and 3x in the EU, creating a strategic opportunity despite Australia’s higher cost base. Long-term success will depend on securing offtake from wafer producers, deploying proven process technologies, and driving local innovation to reduce costs over time.
Exhibit 3: China currently leads on polysilicon production cost and volume with Australia’s potential production costs being 82% higher.[e]
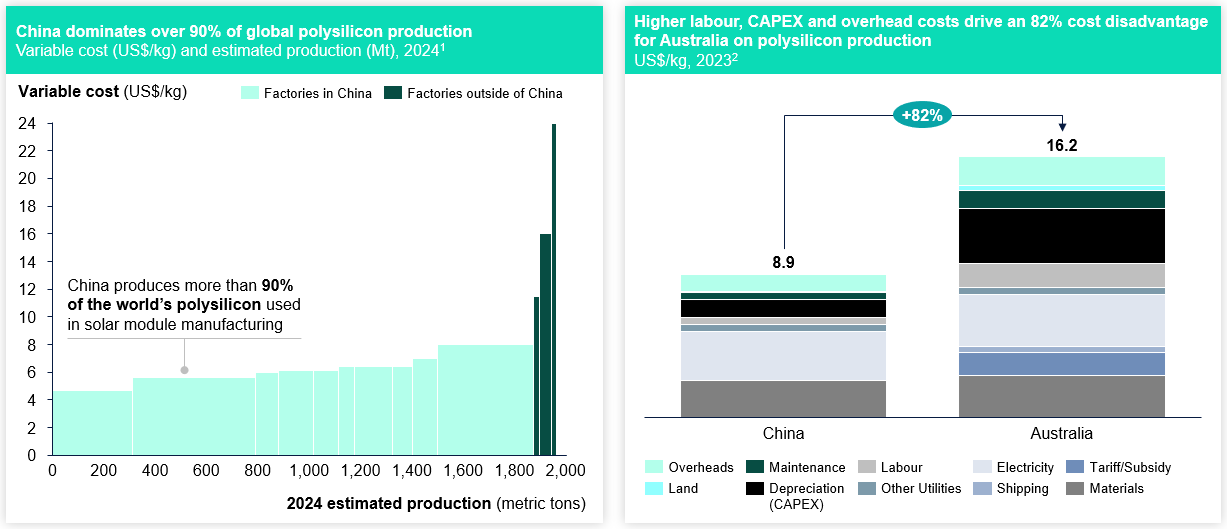
Exhibit 4: However, there is real market evidence of a premium price being paid for ex-China polysilicon (US$/kg, 2022-26)
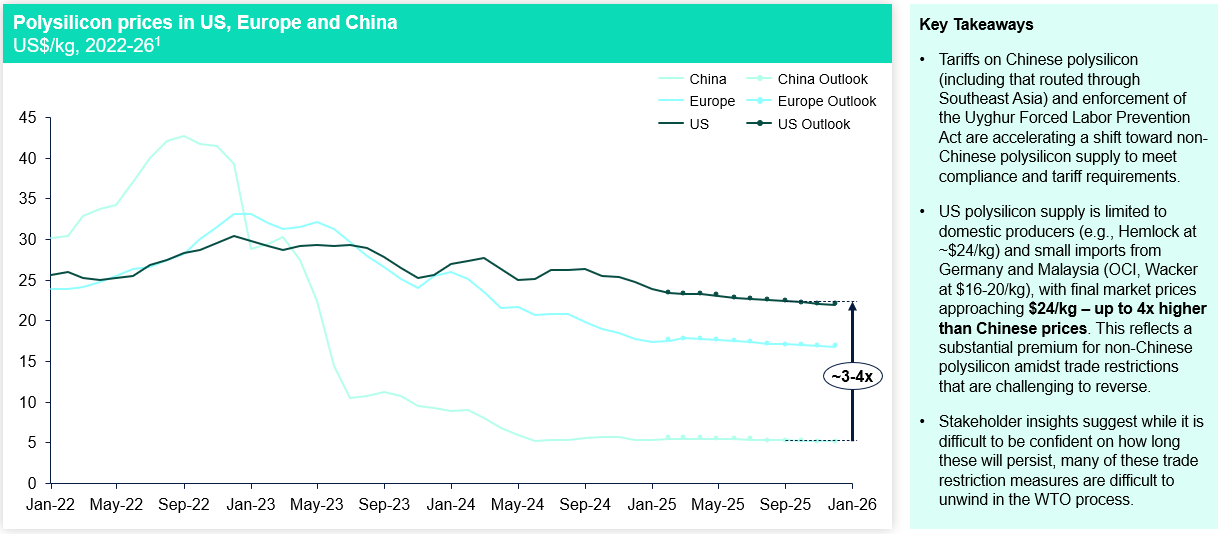
Exhibit 5: Australia could develop cost efficiencies overtime to cement a competitive polysilicon industry even in a scenario where this premium reduces.[g]
Finally, in deployment/balance of plant (BoP), Australia has the potential to meet a theoretical lowest global LCOE due to its solar and wind resources, yet unique conditions in deployment, such as high-cost labour and remoteness challenges, create a need for locally developed solutions and international partnerships.
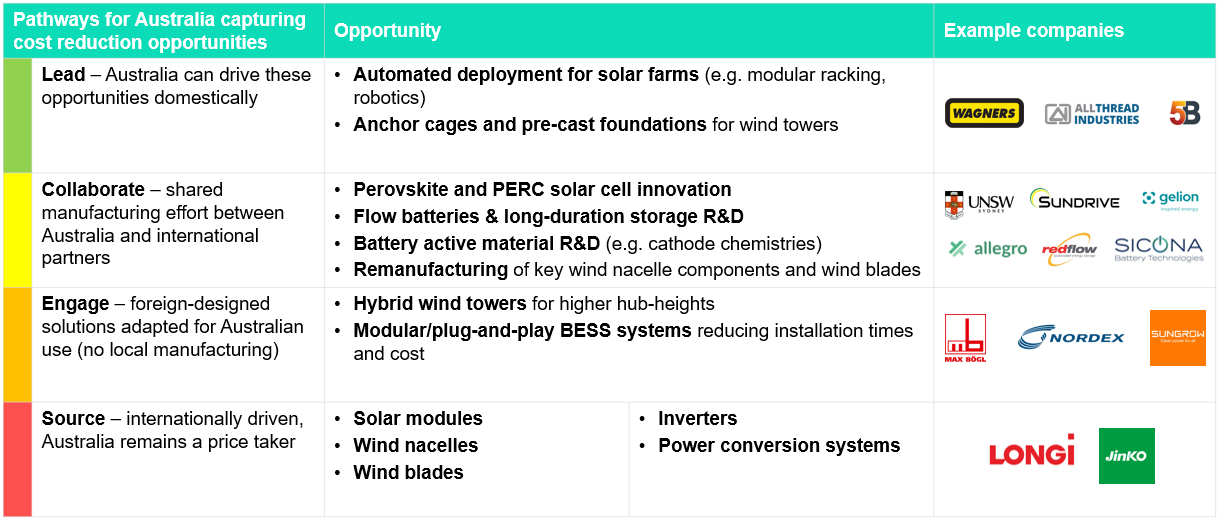
Making this happen requires a four-prong approach:
- Lead: Australia can drive these opportunities domestically (e.g. automated deployment (5B), pre-fab anchor cages for wind turbines);
- Collaborate: shared manufacturing effort between Australia and international partners (e.g. perovskite or PERC solar cell R&D, flow battery R&D and commercialisation);
- Engage: foreign-designed solutions adapted for Australian use (e.g. Hybrid wind towers for higher hub-heights); and
- Source: internationally driven, Australia remains a price taker (e.g. solar modules).
Exhibit 6: Opportunities for Australia to lead, collaborate, engage or source for global best in-class renewables deployment & BoP
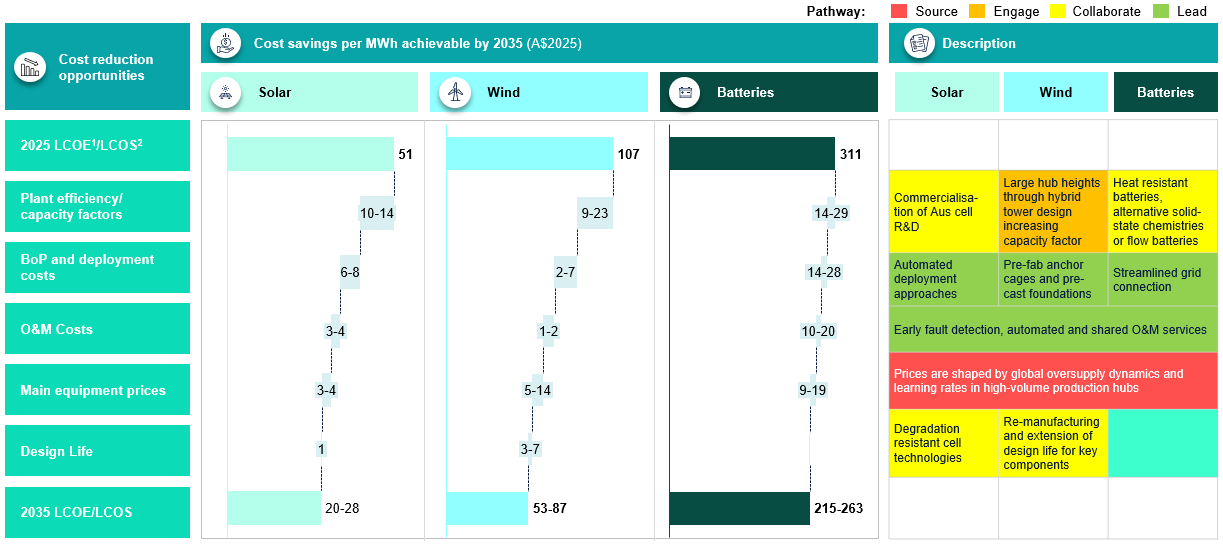
This research shows that Australia can achieve globally competitive renewable energy costs by 2035 by deploying these strategies, with solar costs falling by up to 61%, wind by up to 51% and grid-connected BESS by up to 31% through the following sub-opportunities:
Solar
- Lead: Australia can lead on deployment and O&M cost reductions (A$6-8/MWh and A$3-4/MWh) by scaling local innovations such as modular installs (e.g., 5B Maverick) and robotic vegetation management.
- Collaborate: Australia can collaborate on plant efficiency (A$10-14/MWh) through partnerships that commercialise R&D in tandem and perovskite cells, leveraging institutions like UNSW and firms like SunDrive.
- Engage: Australia can engage on plant design life and system performance by adapting global standards to local site and climate conditions.
- Source: Australia must source modules and inverters, where global manufacturers dominate, and price-setting occurs offshore (A$3-4/MWh savings per category).
Wind
- Lead: Australia can lead in reducing BOP and O&M costs (up to A$9/MWh combined) by localising concrete foundations, hybrid tower bases, and remote maintenance systems.
- Collaborate: To improve capacity factors (A$9-23/MWh), Australia can collaborate with global OEMs to tailor taller turbine designs for local wind conditions.
- Engage: Australia can engage on turbine lifetime and durability (A$3-7/MWh), adapting international specs to suit high-temperature or coastal deployment zones.
- Source: Turbine procurement remains a source activity (A$5-14/MWh) given global scale, limited local manufacturing, and price-setting by offshore OEMs.
Batteries
- Lead: Australia can lead on deployment and O&M cost savings (A$14-28/MWh and A$20-28/MWh) through local EPC innovations, site optimisation, container integration, and remote servicing.
- Collaborate: Australia can collaborate to improve round-trip efficiency by working with global cell developers to trial new chemistries and integrate systems locally.
- Engage: Australia can engage on BOP integration (A$3-7/MWh) by configuring imported PCS, cabling, and switchgear to local site conditions.
- Source: Battery cell and module costs (A$28-39/MWh) remain internationally set, with Australia relying on imports from China, South Korea, and the US.
Exhibit 7: Ability to reduce LCOE through best in class renewables deployment.[h]
Overall, Australia has a credible opportunity to strengthen its position in clean tech manufacturing in generation by focusing on three priority areas: critical minerals refining, polysilicon, and deployment and balance of plant solutions. While Australia is unlikely to compete across every part of the generation supply chain, it can build globally relevant advantages where it has strong natural resources, integration opportunities, technical capability, and a clear need for local adaptation. With targeted policy support, strategic partnerships, and continued innovation, these opportunities could boost economic value, improve supply-chain resilience, and help deliver globally competitive renewable energy costs by 2035.
Footnotes:
[a] Cyan Ventures analysis
[b] For vertical integration materials for Australia are taken at cost rather than market prices. Cyan Ventures analysis
[c] IEA (2024)
[d] S2S (2024)
[e] 1. BNEF (2024), Variable costs includes processing cost and selling, general and administrative (SG&A) expenses; depreciation excluded; 2. S2S (2024)
[f] 1. Business Analytics IQ (2024); 2. Assumes best case on energy costs, CAPEX, materials and labour for EU/US – NREL (2024) & Fraunhofer ISE (2024); S2S (2024)
[g] 1. S2S (2024). 2. Assumes $50 USD/MWh electricity price down from $65 USD/MWh. 3. Lower bound from S2S. 4. S2S estimated that Mg-Si and other material costs would be $2.90 USD/kg in Australia through importing Mg-Si and other materials from China and that the cost for using domestic Mg-Si would be closer to $4 USD/kg. Quinbrook and Sol Quartz suggest that the price of Mg-Si which would be a cost input for polysilicon in Australia through their integrated supply chain would also be $4 USD/kg. 5. NREL (2024) & Fraunhofer ISE (2024). 6. It is estimated that the all-in cost of importing Mg-Si from a non-Chinese country would be closer to $2.60 USD/kg. This would be $1.40 USD/kg cheaper currently than sourcing from domestic Mg-Si producers.
[h] 1. Levelised Cost of Energy (LCOE) refers to the average cost of generating one megawatt-hour of electricity over the lifetime of a plant, incorporating capital, operating, and maintenance costs. Estimates shown here assume a standard run-of-plant profile and do not include costs associated with firming, or storage. 2. Levelised Cost of Storage (LCOS) refers to the average cost of storing and discharging one megawatt-hour of electricity over the lifetime of a storage system. It includes capital, operating, maintenance, and charging costs, and includes assumptions about round-trip efficiency, storage duration, and usage cycles.